
Each visual artifact was generated with the aid of Python libraries, namely
Seaborn and Matplotlib. Apart from the programming component, previous steps that were applied to clean and
transform the data features were also considered to identify underlying patterns exhibited by the data
points.
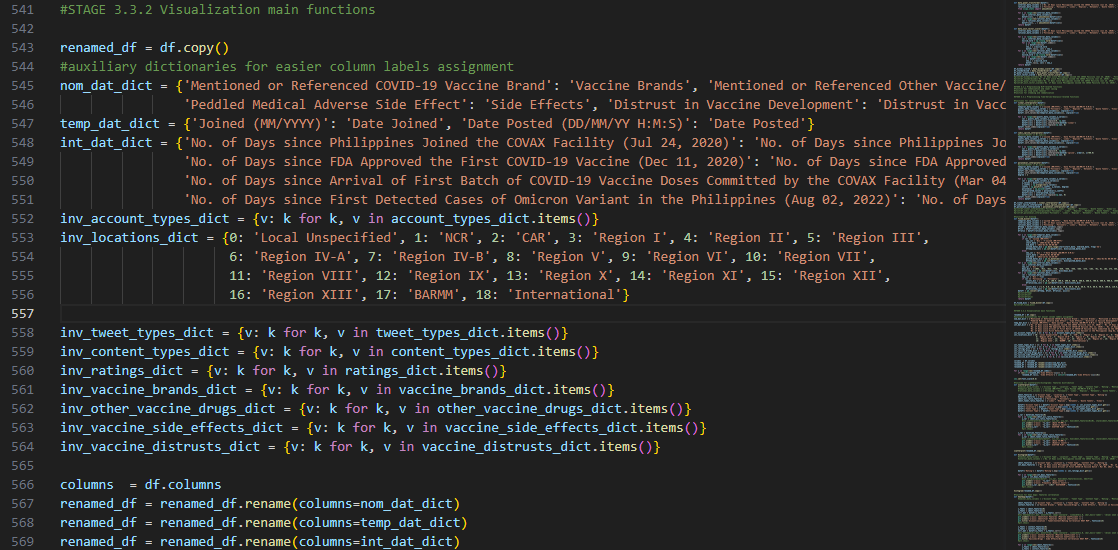
As a prerequisite to visualizing our dataset, we instantiated new auxiliary dictionaries which we used
as assistive tools to have a better representation of our data features. These dictionaries also enabled us
to encode and decode the data values for plotting more flexibly.
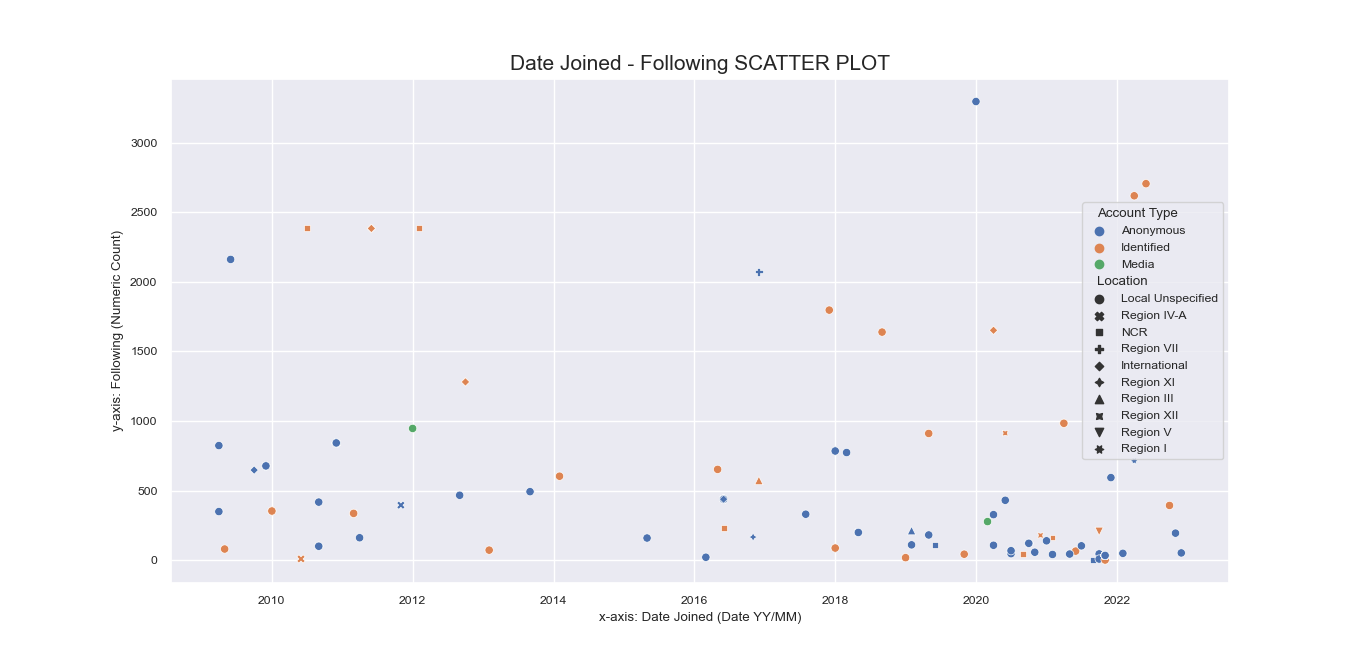
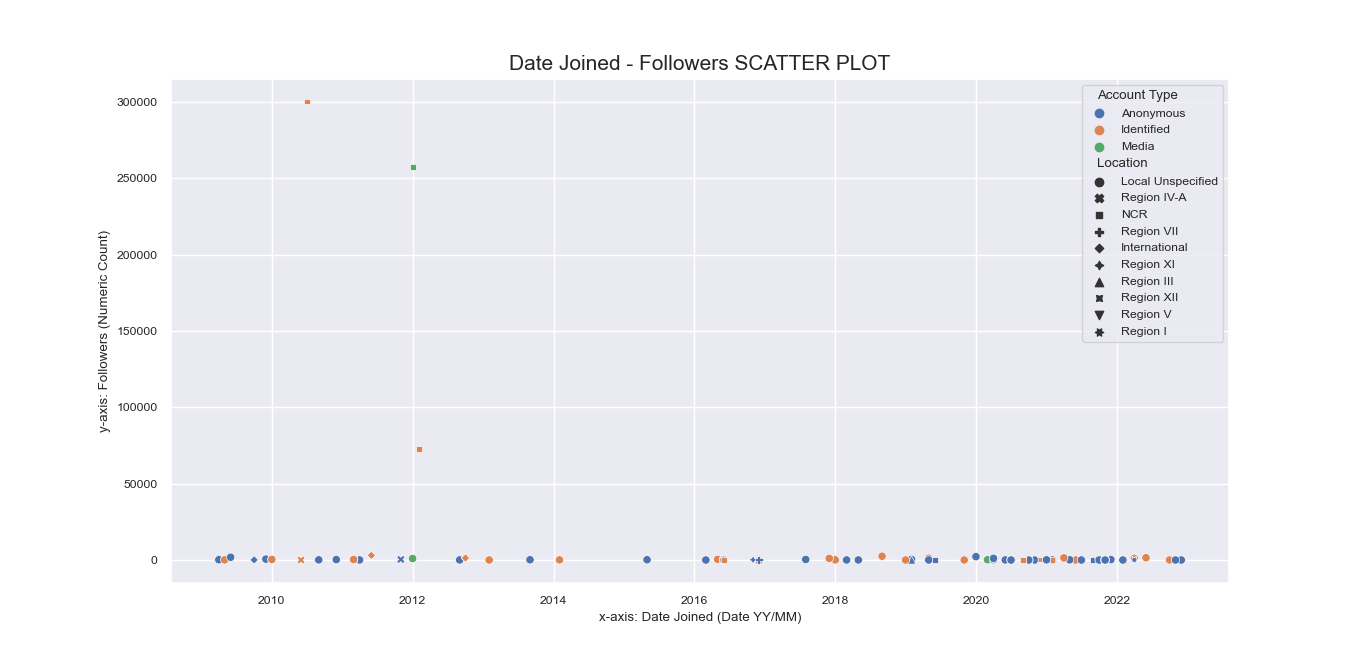
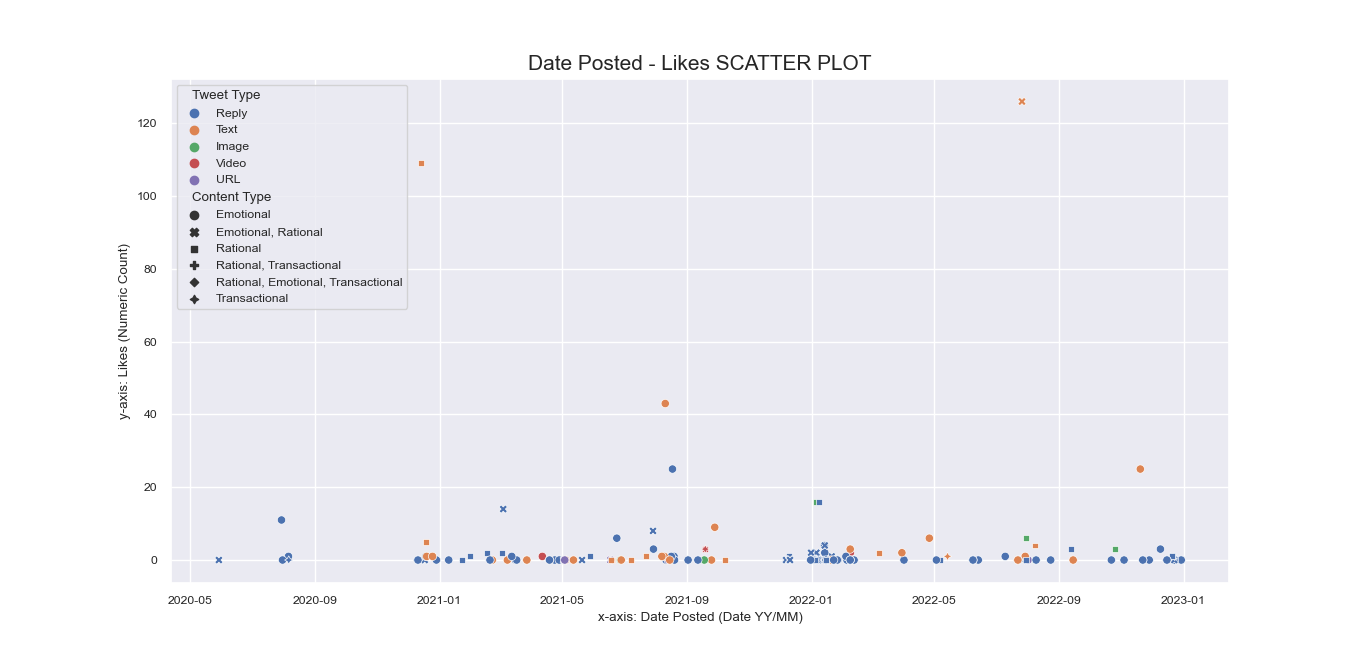
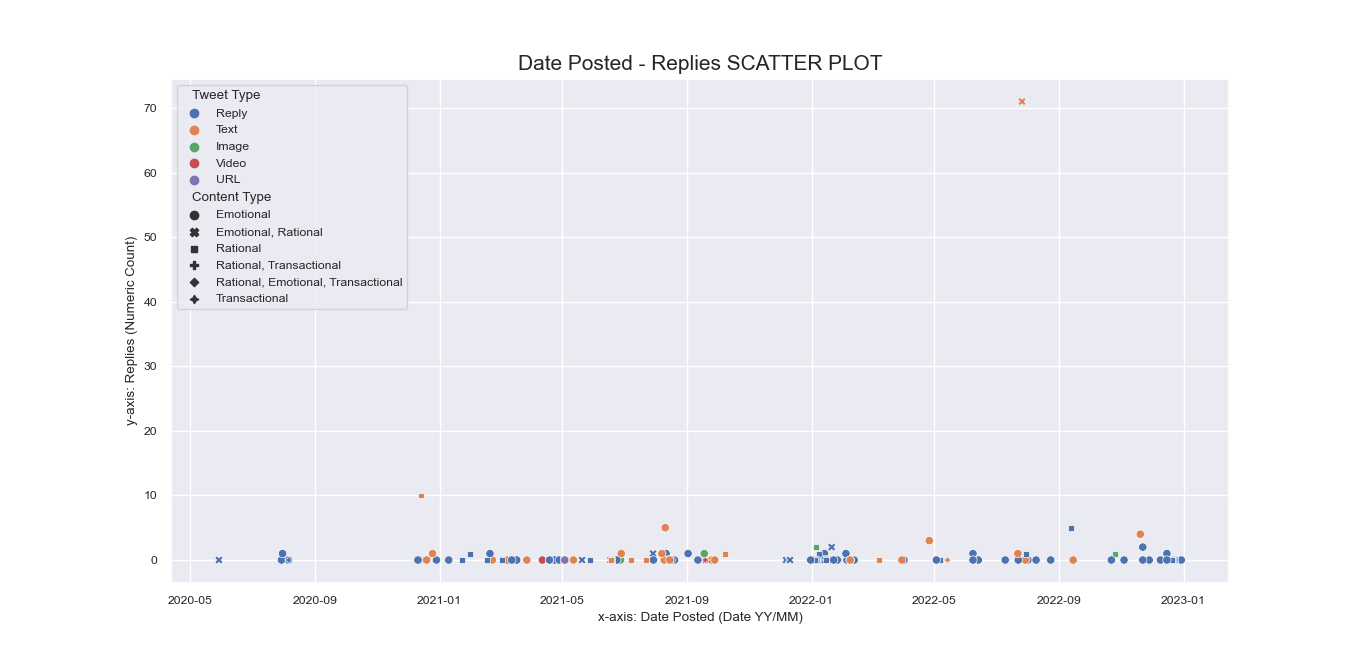
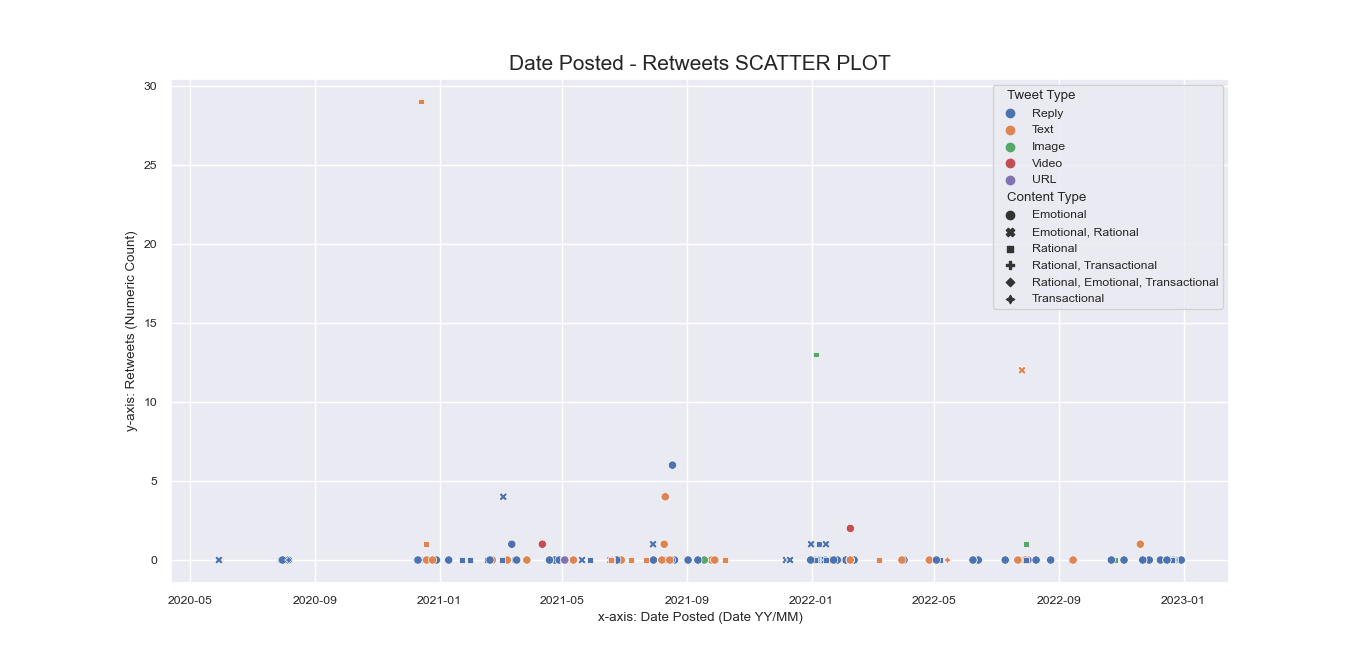
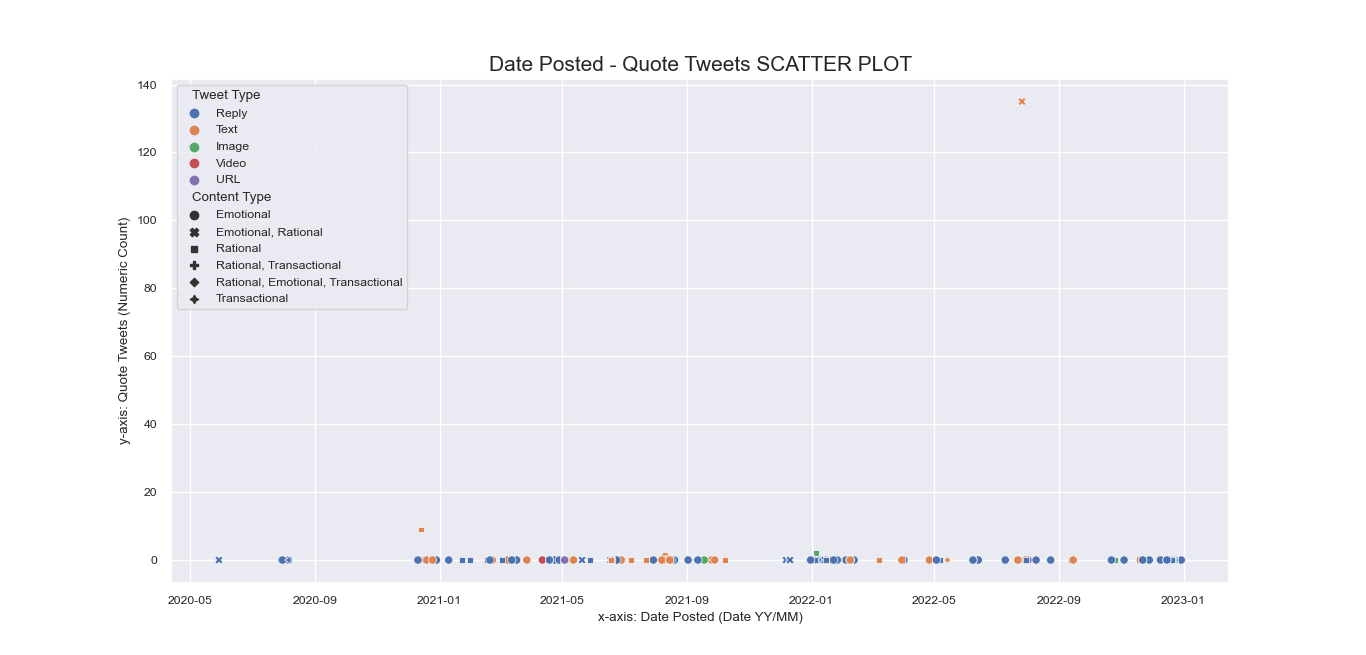
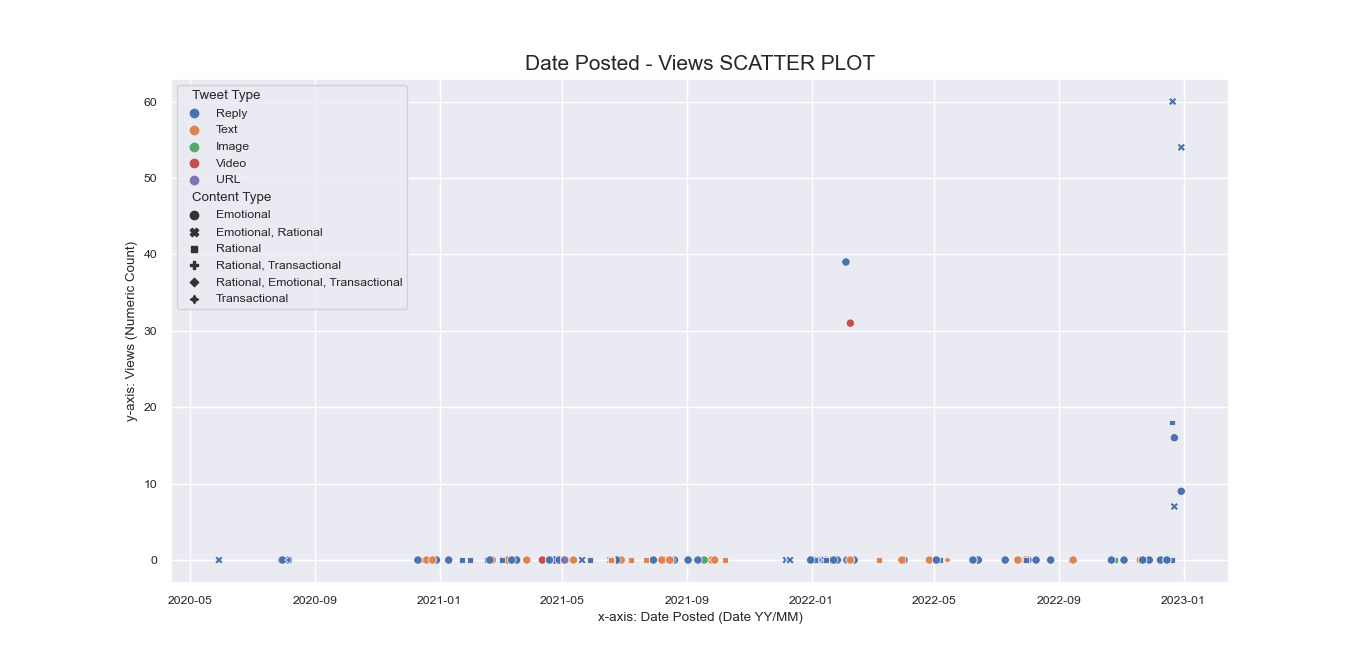
To visualize the distribution of the tweet/account categories and tweet metrics in
relation with our temporal data, we used scatter plots to provide insight into possible patterns and
highlight the outliers that we detected in earlier steps.
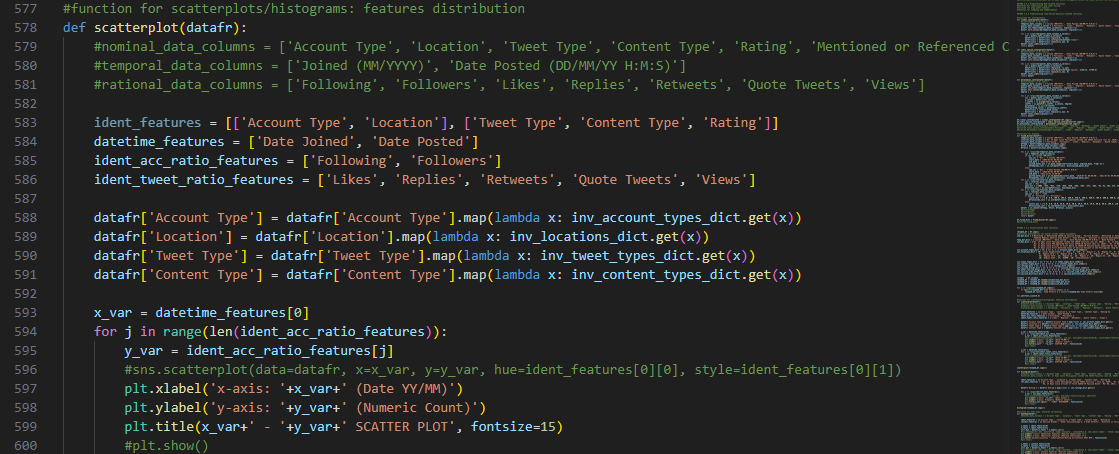
The data features were divided into sub-lists of characteristics that
either pertain to the account owner or the tweet itself.
Corresponding temporal data applicable to either of the aforesaid sub-lists were then used as the
independent variable.
Since categorical data were encoded earlier, we then decoded them back to their original representations
upon plotting so the readers would understand them.
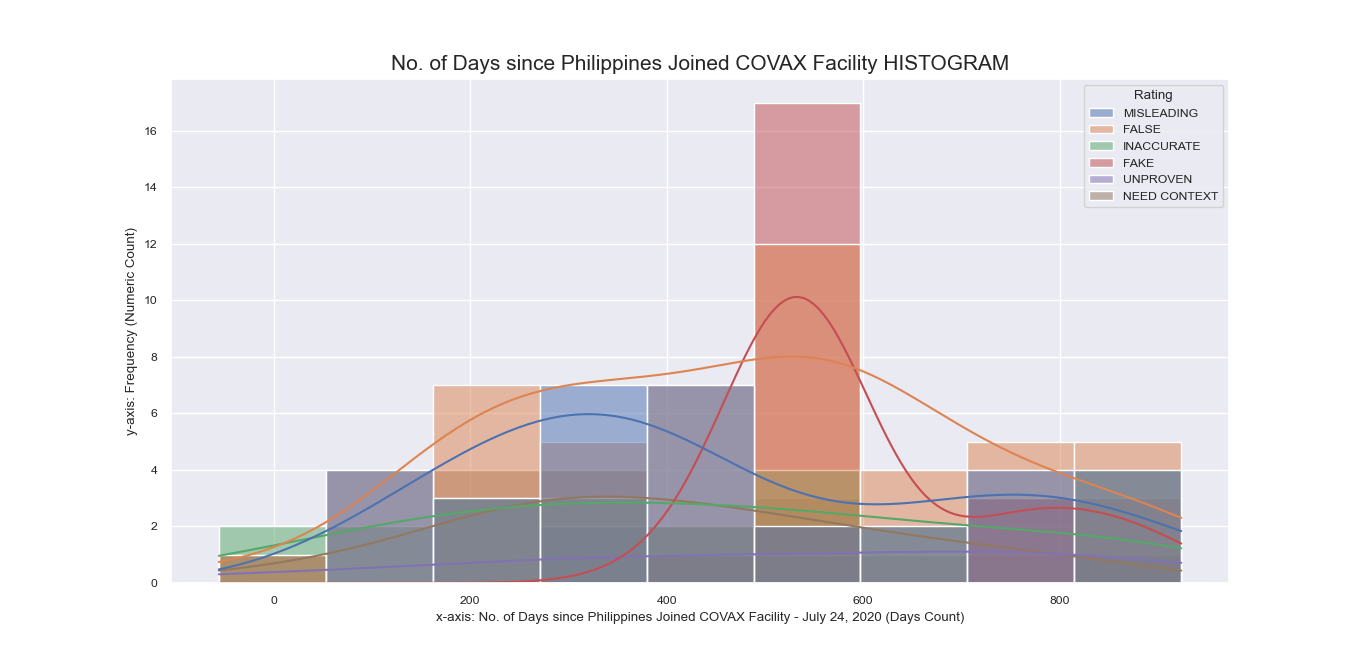
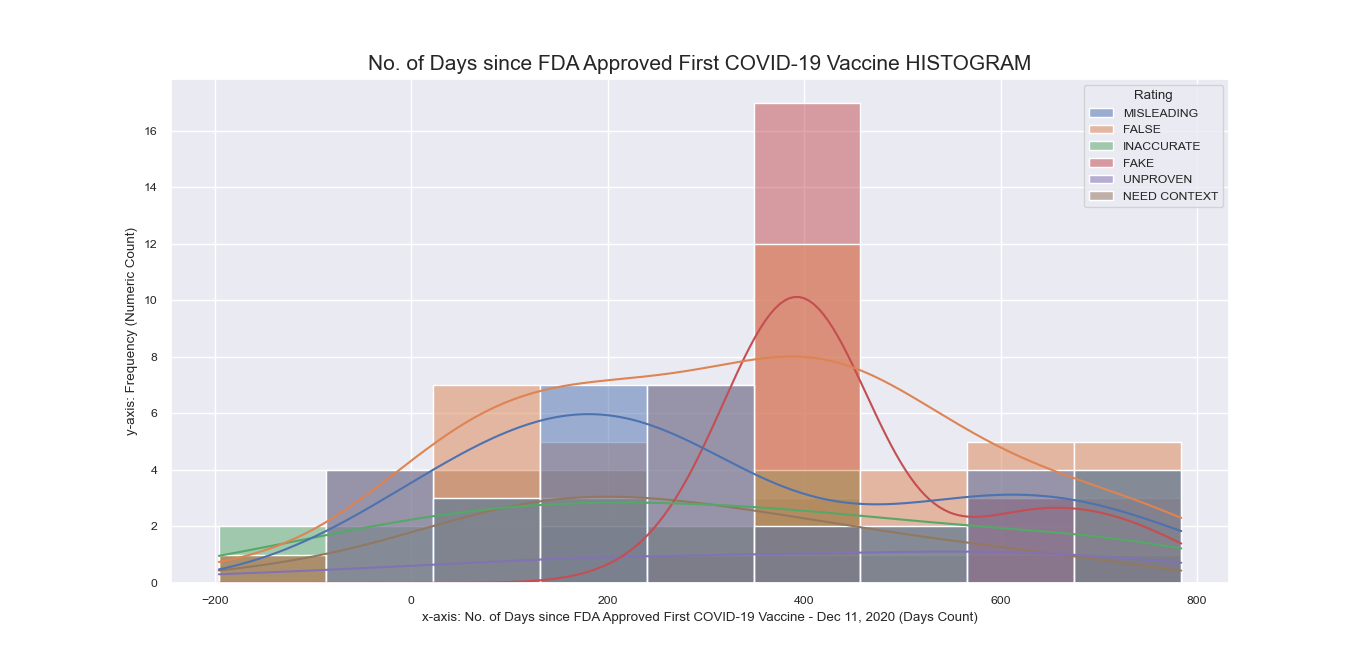
Provided that we also have discrete data that describe the number of days from
when a tweet was posted to a significant COVID-19-related local event, we used histograms to arrive at a
visual summary of the binning for the range of values being measured.
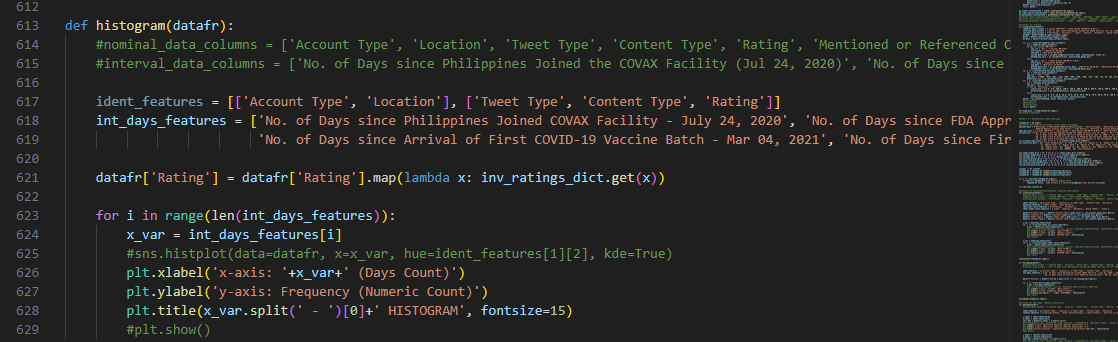
Using Seaborn histplot(), the
histograms for data features relevant to number of days were color-coded according to their fake news
rating.
The method above also has an optional parameter for kernel density, which we applied to attain a smooth
representation of the distribution of the number of days.
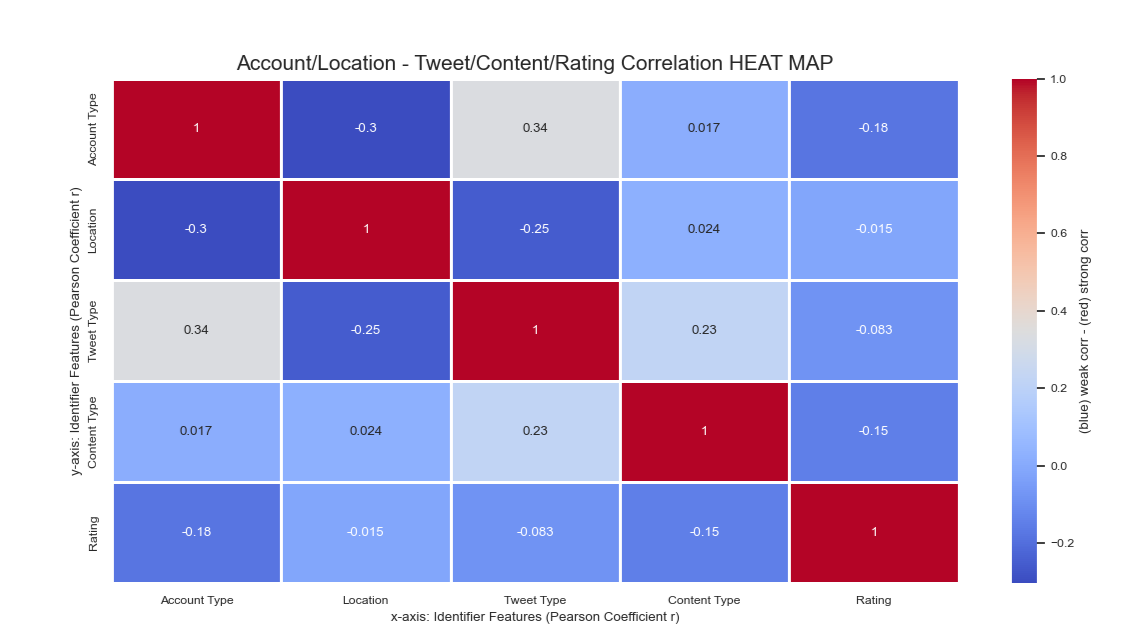
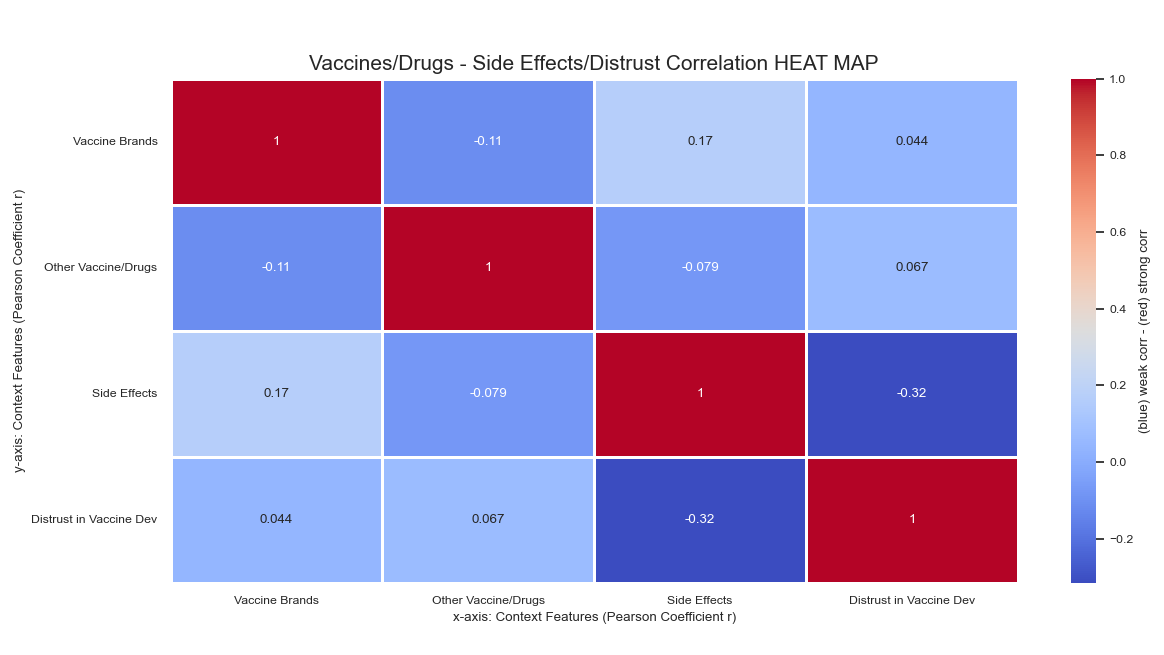
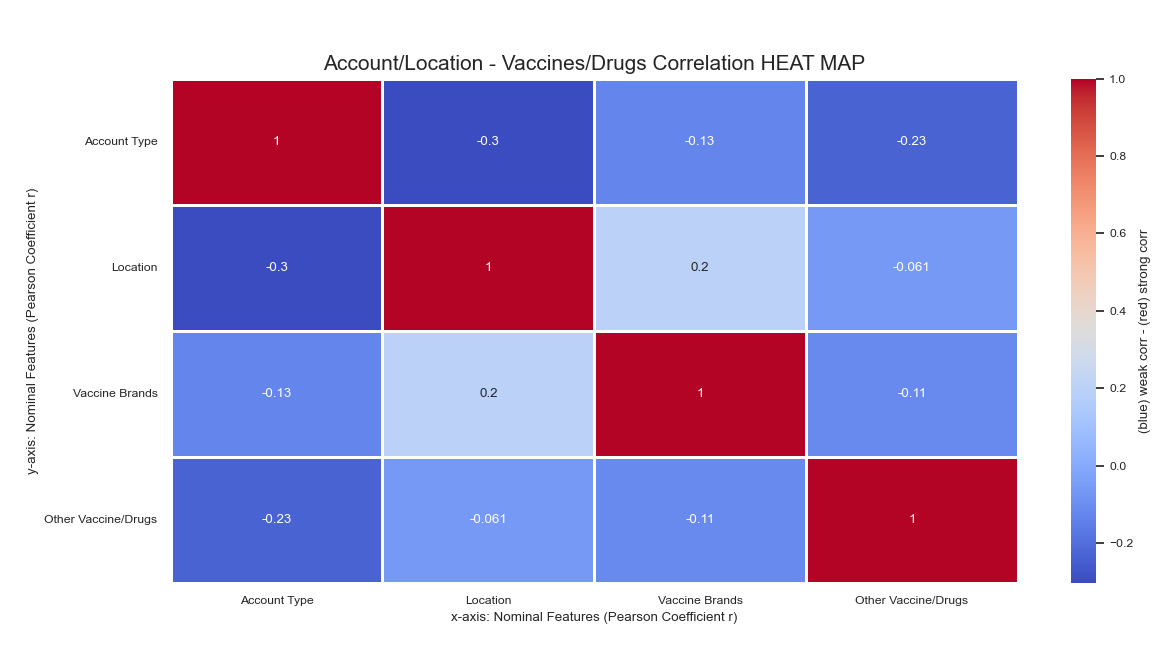
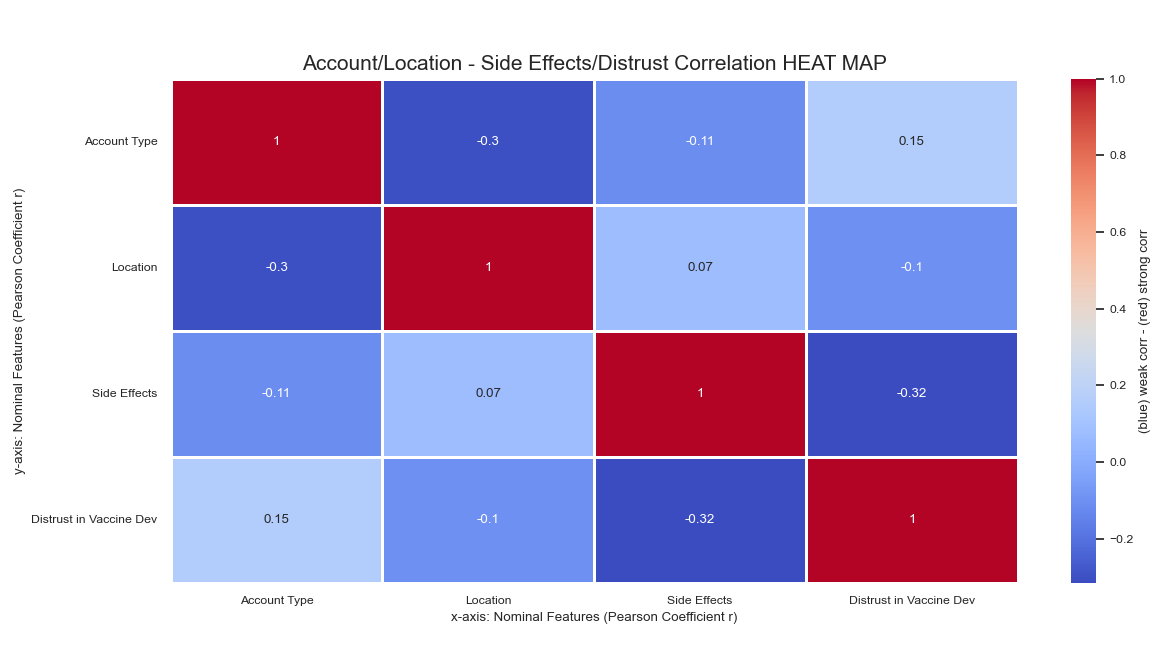
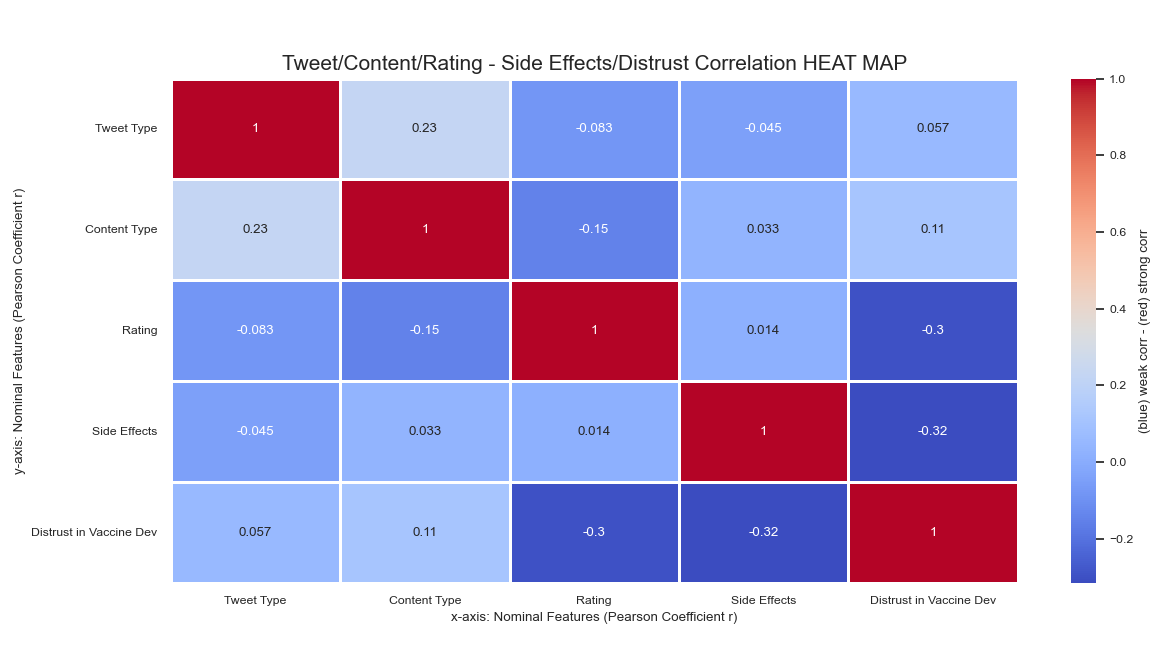
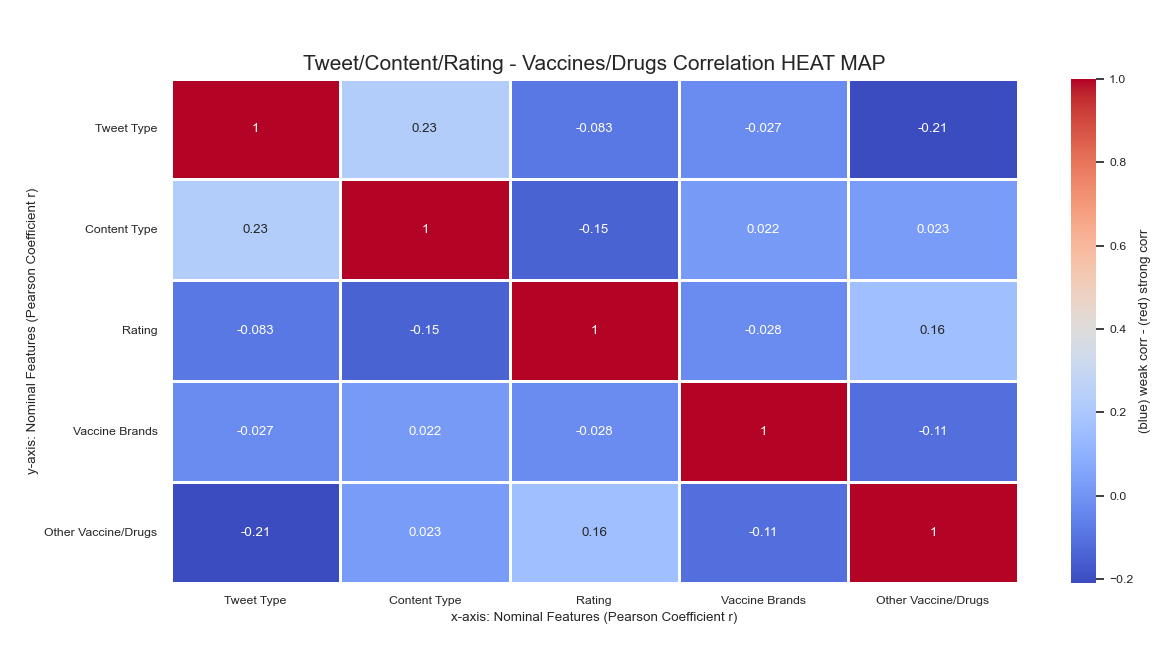
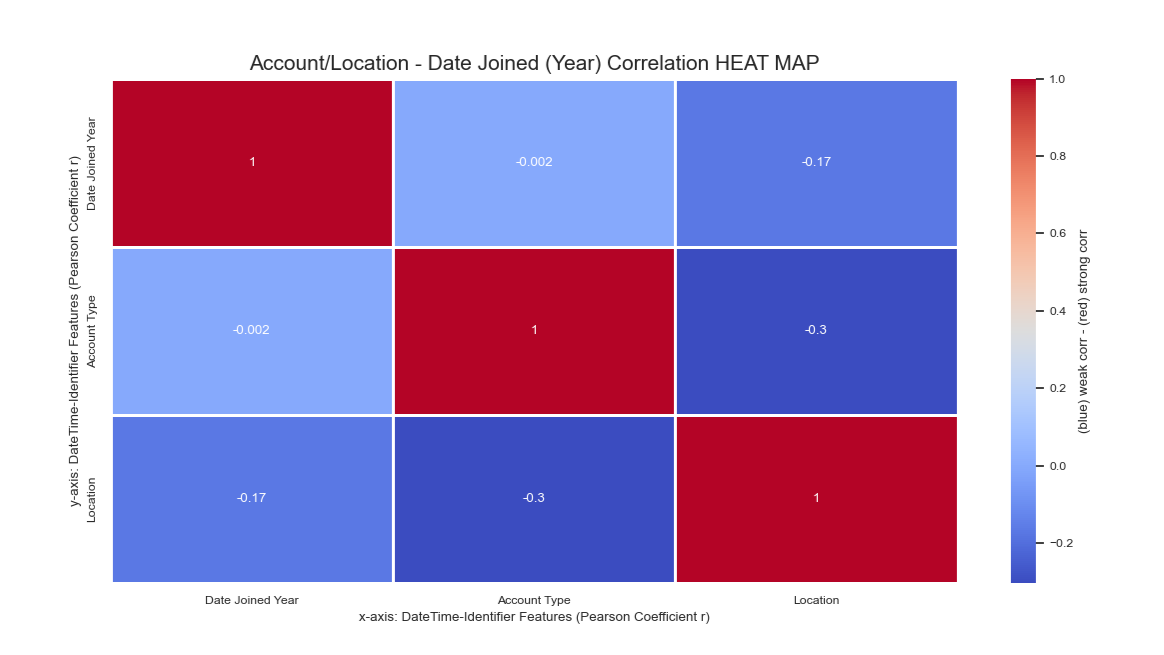
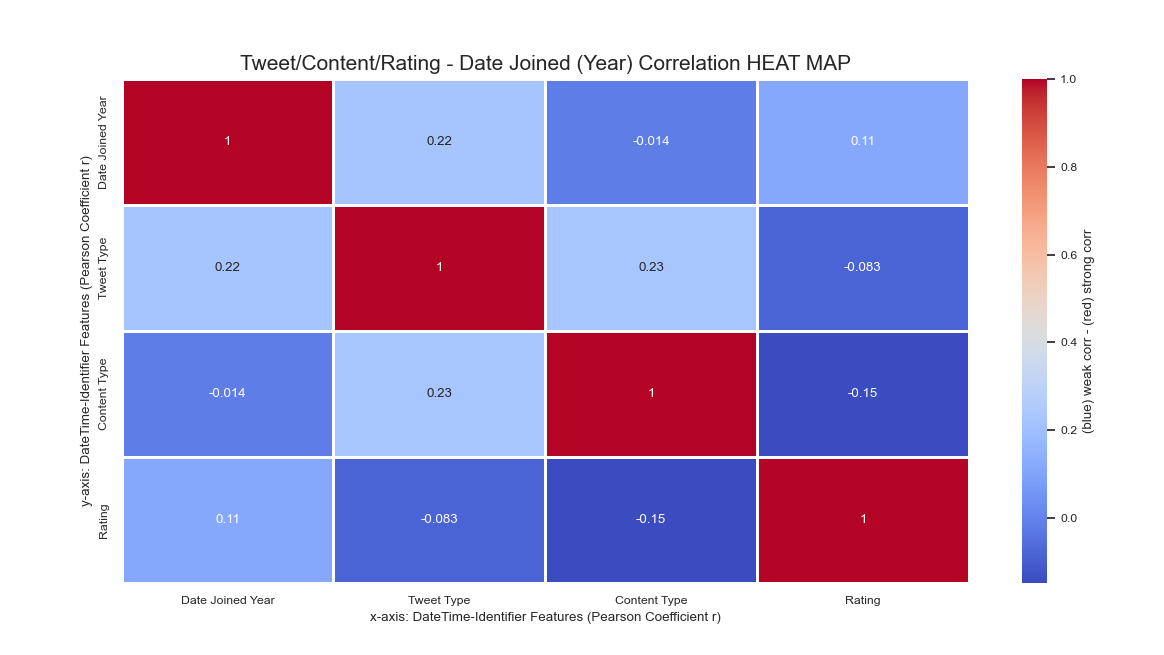
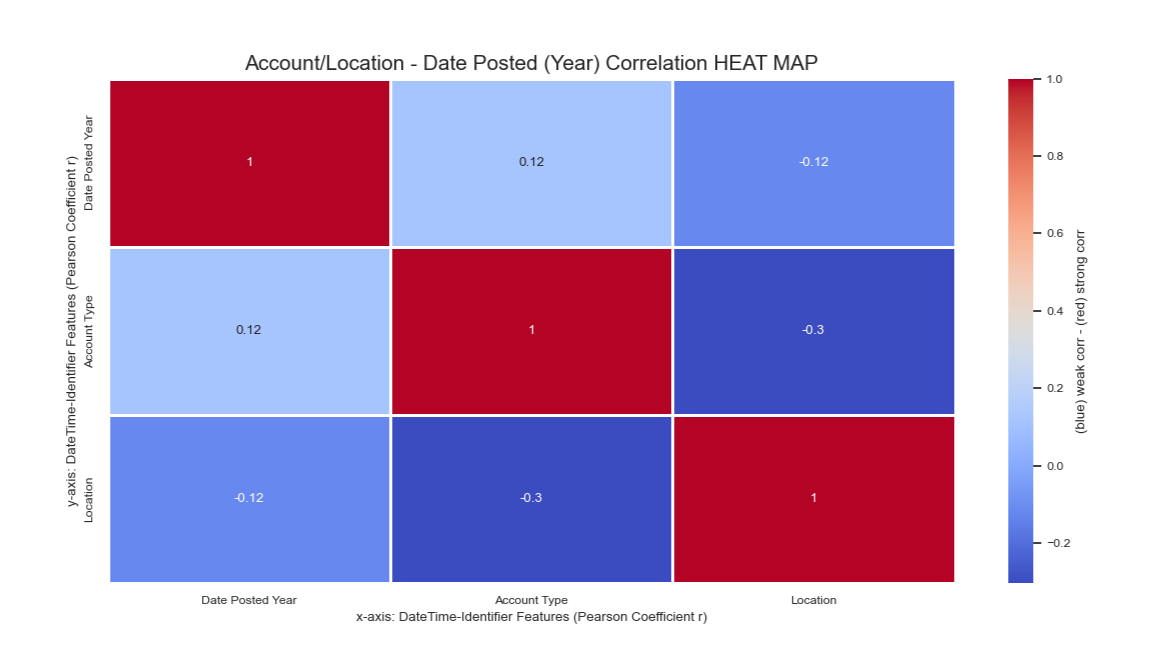
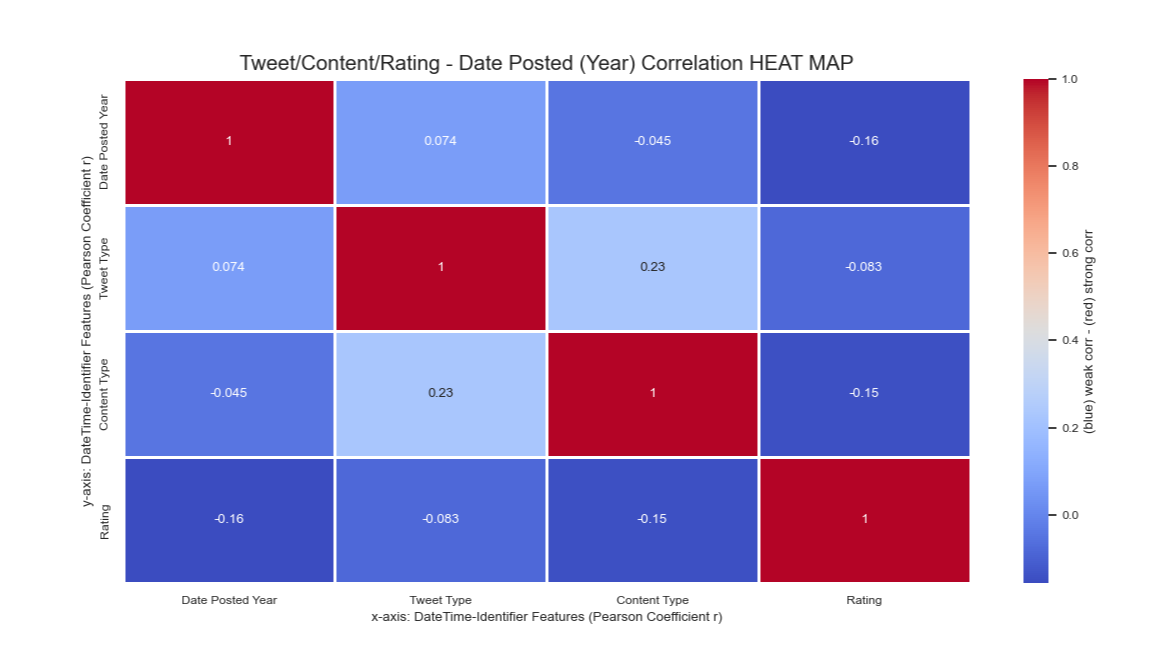
With the purpose of generating a graphical representation for identifying the
relationship between our nominal data variables, we opted to use heat maps. A correlation matrix is created
before application to further help us quantify our categorical features.
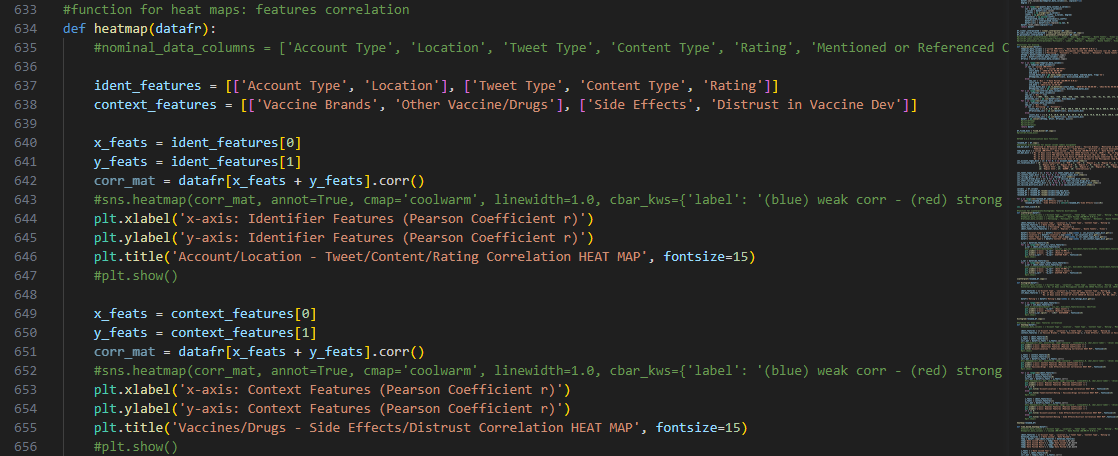
The features were first compared with data characteristics that are
in the same sub-list as theirs and are pertaining to the same data entity i.e., twitter account or tweet
itself.
Afterwards, each sub-list was then associated with other sub-groups of data features using Pandas corr() method to compute for pairwise correlation.
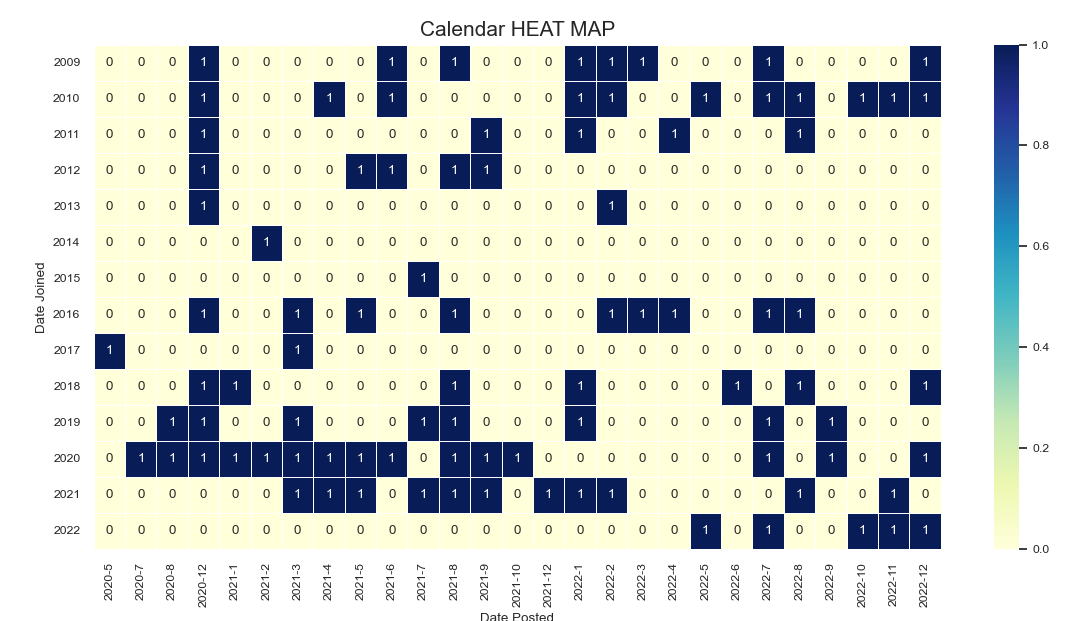
As an attempt to incorporate temporal information into the analysis of our nominal
data, we also created calendar and time-based heat maps to visualize patterns, if there are any, related to
our variables across certain time periods.
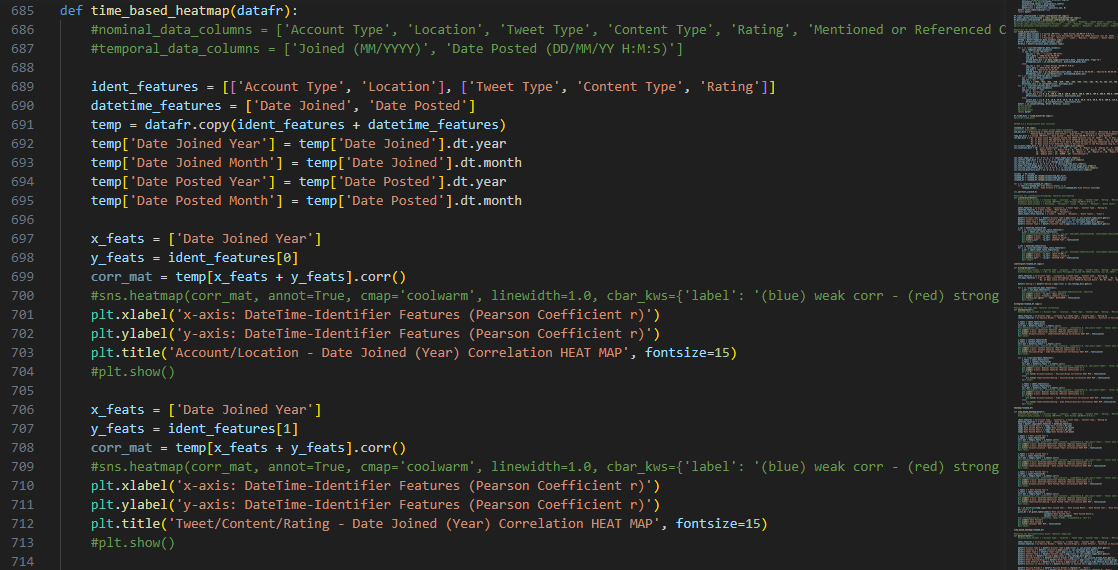
Features of DateTime dtype
were first manipulated to obtain months and years data points into separate columns, adding up four new
columns into the dataset.
The same heatmap() method was then applied to the year attributes
of each temporal component and to their corresponding sub-list of categorical data.
For creating a calendar heat map, the dataframe had to be re-structured using
pivot_table(), which places the ‘Date Joined Year’ values into
corresponding rows and ‘Date Posted’ attributes as columns.
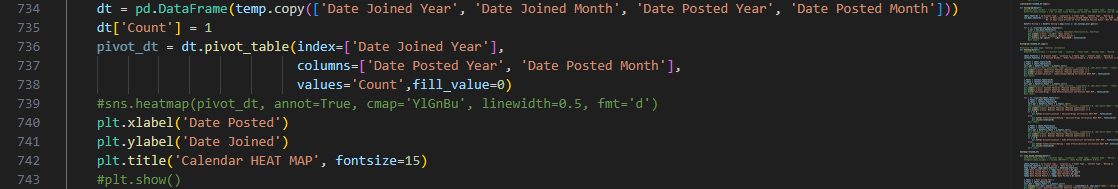
The resulting cell values of this block of code are zeroes (0) and
ones (1), which describe the month-year combinations of when tweets are posted in relation with the age of
the accounts (how old is the account, not account owner) that posted them.